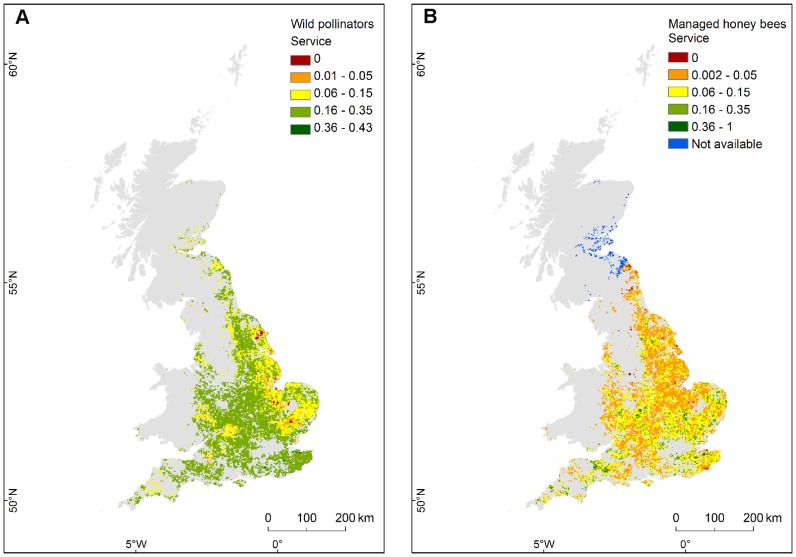
Figure 5. Pollination service to field beans, from wild and managed pollinators.
Maps show the potential pollination service to field beans, provided by nine wild pollinator species (A) and by managed honey bees (B). Zero indicates areas lacking pollinator service (minimum service is 0.01 from wild pollinators, 0.002 from managed honey bees). Interval classes are manually defined to the same scale. Blue colour in (B) indicates areas where pollination service cannot be estimated due to missing information on honey bees' presence. Map projection: BNG.

