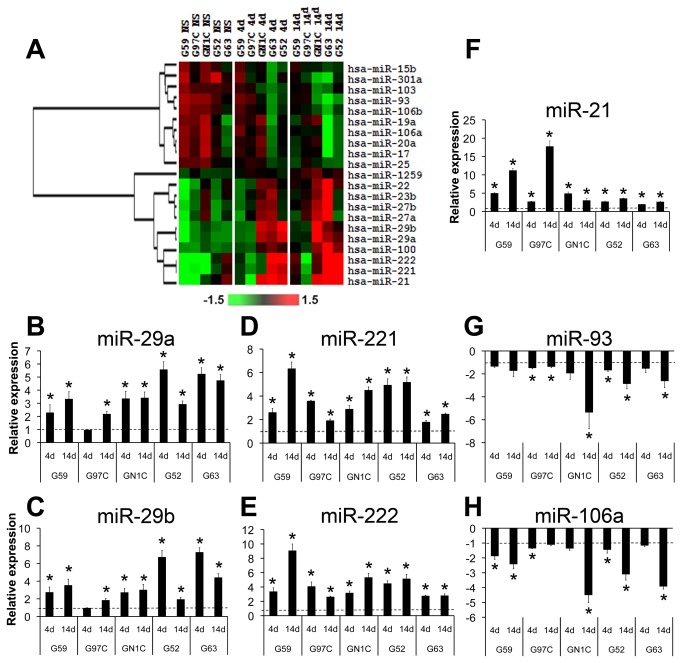
Figure 3. Microarray profiling of miRNA expression during NS differentiation.
A heat map of a hierarchical clustering analysis of the microRNAs with differential expression between the NS cell lines at their basal state (NS) and after 4 (4d) and 14 (14d) days of induction of differentiation is displayed (A). Expression data are represented as log2Ratio and were mean centered for each miRNA. Validation of the differential expression of miR-29a (B), miR-29b (C), miR-221 (D), miR-222 (E), miR-21 (F), miR-93 (G) and miR-106a (H) was carried out by q-RT-PCR using specific TaqMan microRNA assays, normalizing their expression values with respect to RNU6B levels and to the NS state by calculating 2-ΔΔCt. * indicates statistical p value <0.05 using unpaired t-test with the Holm-Bonferroni correction for multiple comparisons; dotted lines indicate the basal expression level at the NS state.

