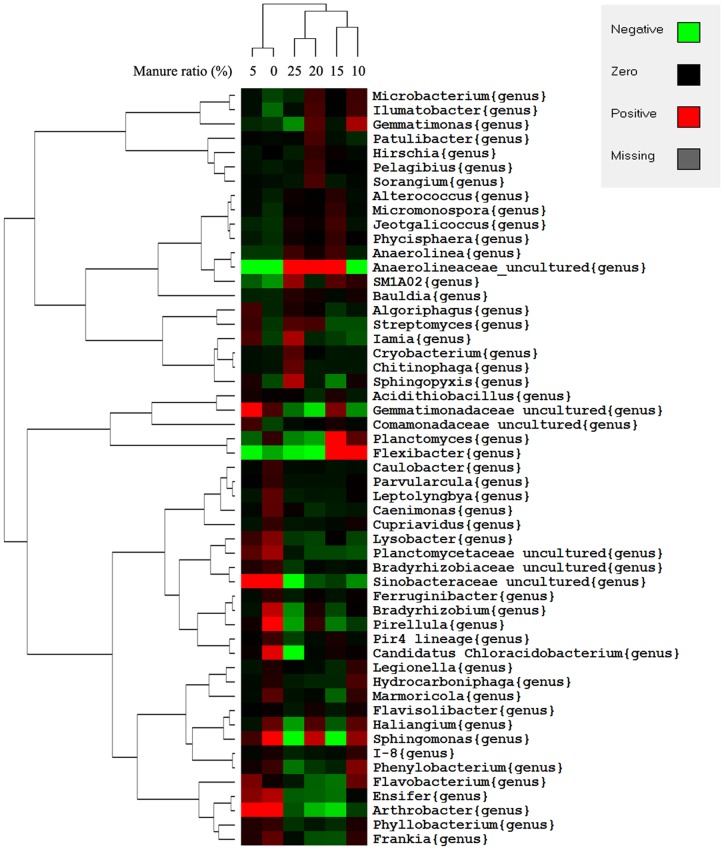
Figure 4. Genus level bacterial distribution among the six samples.
The phylogenetic tree was calculated using the neighbor-joining method, while the relationship among samples was determined using Bray distance and the complete clustering method. The heatmap plot was generated by Gene cluster and Tree View (written by Michael Eisen, Stanford University). Genuses with >0.1% relative abundances are quoted and the species were mean centered before clustering.

