
Figure 5. Shared species analysis of the different treatment groups.
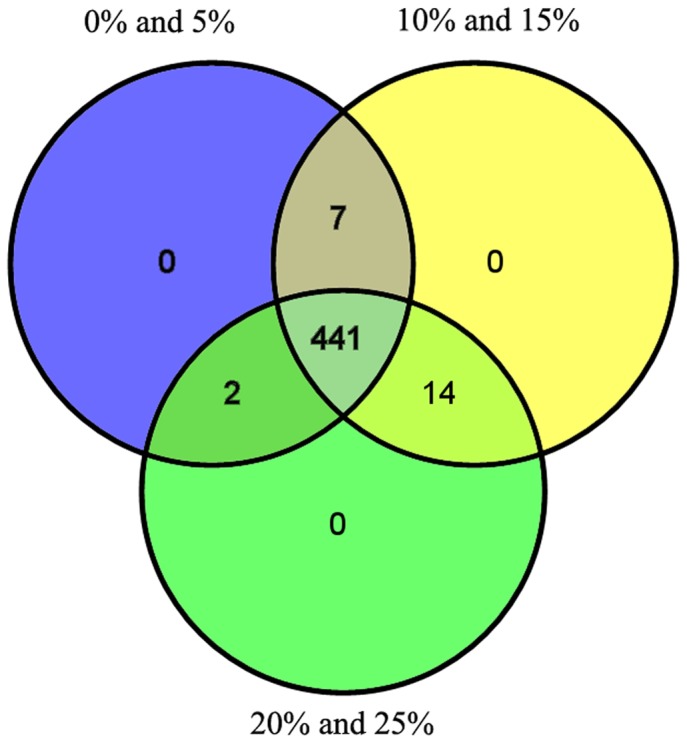
The Venn diagram shows the unique and shared species among the different treatments.
Official websites use .gov
A
.gov website belongs to an official
government organization in the United States.
Secure .gov websites use HTTPS
A lock (
) or https:// means you've safely
connected to the .gov website. Share sensitive
information only on official, secure websites.
The Venn diagram shows the unique and shared species among the different treatments.