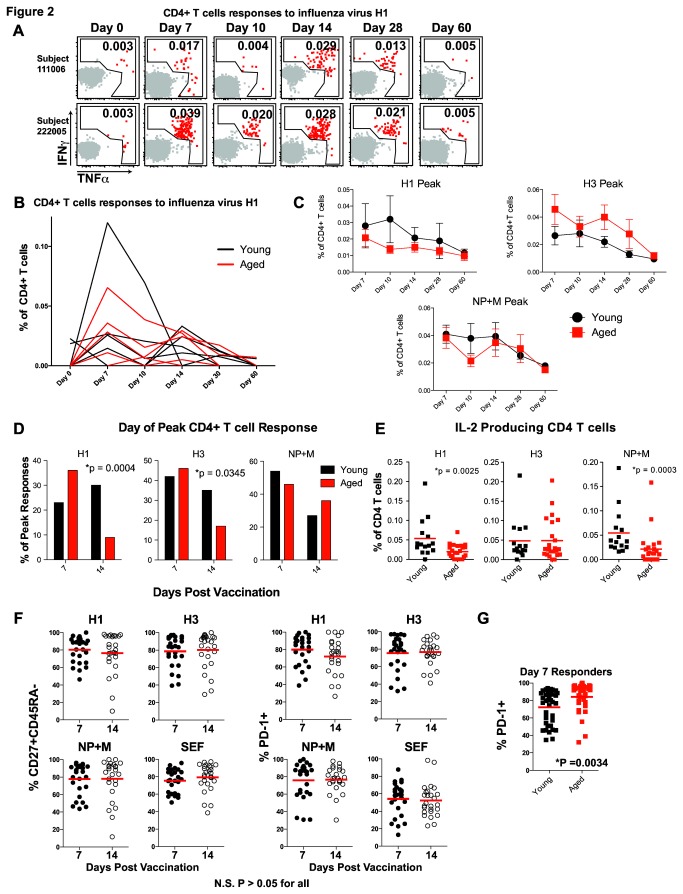
Figure 2. CD4 T cell response kinetics after TIV.
(A and B) Vaccine-induced responses were defined as an increase in cytokine production compared to the d0 response and were examined over time for each subject. Representative flow cytometry plots (A) and kinetic graphs (B) show changes in cytokine production over time after vaccination. Examples of responses to H1 from young and aged are shown illustrating gating and changing percent of responding CD4 T cells over time (A). The numbers in A indicate the percent of CD4 T cells making IFNγ and/or TNFα. Line graphs for multiple subjects demonstrate the range and kinetics for multiple young (black) and aged (red) subjects (B). Summarized data for young (black) and aged (red) show the mean and standard error for responses to each protein over time (C). The number of subjects peaking on day 7 versus day 14 was compared between young (black bars) and aged (red bars) subjects for responses to H1, H3, or NP+M (D). Statistical testing was performed using the Fisher’s exact Chi-squared. Summary data for IL-2 production to each peptide pool is shown for young (black) and aged (red) (Mann-Whitney) (E). Differentiation phenotype (CD27+CD45RA- on left or PD-1+ on right) of influenza virus-specific CD4 T cells peaking on day 7 or day 14 post-TIV for individual influenza proteins (F). For this analysis young and aged subjects were combined to test whether CD4 T cell responses peaking on day 7 differed from those peaking on day 14. Separate analysis of expression of PD-1 on influenza virus-specific CD4 T cells from young (black symbols) versus aged (red symbols) subjects was performed on day 7 post-TIV (Mann-Whitney) (G).

