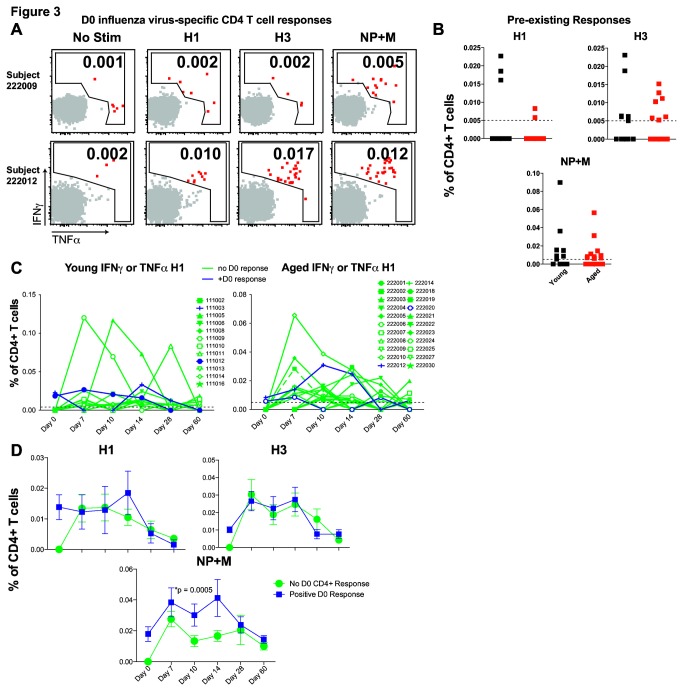
Figure 3. Influence of pre-existing influenza virus-specific CD4 T cells on TIV response.
Representative flow cytometry plots of subjects without (top) or with (bottom) significant day 0 positive responses are shown (percent of responding CD4 T cells is indicated) (A). Pooled data summarize day 0 influenza virus-specific CD4 T cells for each viral protein in young (black) or aged (red) subjects (B). Dotted line indicated the limit of detection based on background (no stim control). Graphs of H1 responses over time after TIV in young (left) or aged (right) subjects with no day 0 influenza virus-specific CD4 T cells (green) or positive day 0 responses (blue) (limit of detection marked by dotted line) (C). Summary data with mean and standard error of CD4 TIV response in combined young and aged subjects with no day 0 influenza virus-specific CD4 T cells (green) or positive day 0 responses (blue) for each influenza virus protein (ANOVA) (D).

