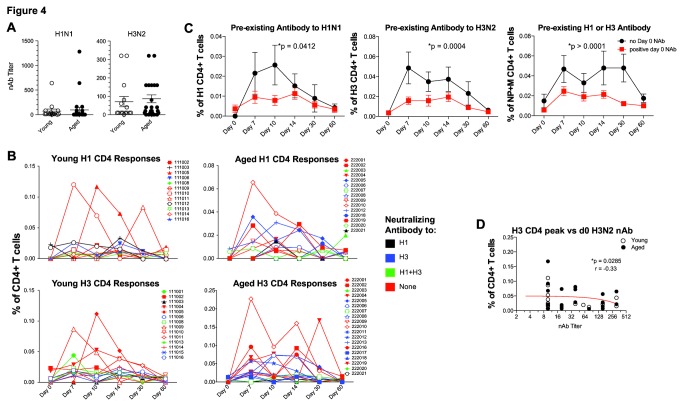
Figure 4. Effect of pre-existing NAb on TIV CD4 responses.
Day 0 NAb titers are shown for H1N1 (left) or H3N2 (right) in young (open symbols) or aged (closed symbols) subjects (A). Kinetics of CD4 T cell responses in young (left) or aged (right) to H1 (top) or H3 (bottom) in relation to presence or absence of day 0 NAb to H1 (black), H3 (blue) both H1 and H3 (green), or neither strain (red) (B). Magnitude of CD4 T cell responses combining data for young and aged subjects to H1 (left), H3 (center), or NP+M (right) for subjects with (red) or without (black) day 0 NAb titers (ANOVA) (C). Correlation of NAb to H3N2 (x axis) versus peak anti-influenza virus H3 CD4 T cell response (y axis) is shown for all subjects (young - open circles; aged - closed circles) (D).

