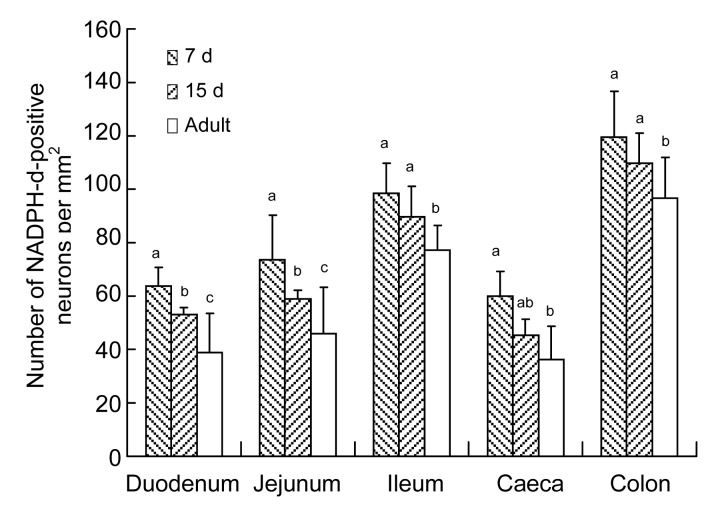
Fig. 5.
Number of NADPH-d-positive neurons per mm2 in 7-d-old, 15-d-old, and adult chickens in different segments of the intestine
Data are expressed as mean±SD (n=5). Different superscripts above the bars represent the significant differences among the number of NADPH-d-positive neurons per mm2 in the same segment of different age groups (P<0.05)

