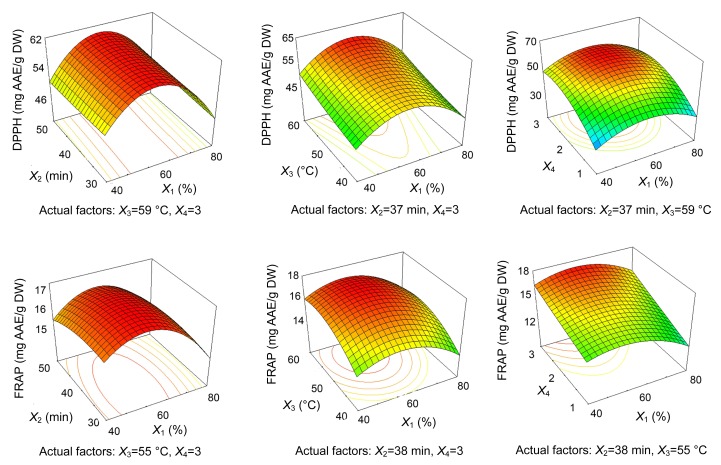
Fig. 6.
Tri-dimensional response surface contour plots showing the effect of co-variance in ethanol concentration (X 1)/extraction time (X 2) (left), ethanol concentration (X 1)/extraction temperature (X 3) (middle), and ethanol concentration (X 1)/number of cycles (X 4) (right) on the DPPH free-radical scavenging potential and FRAP of polyphenols from leaves of F. virens

