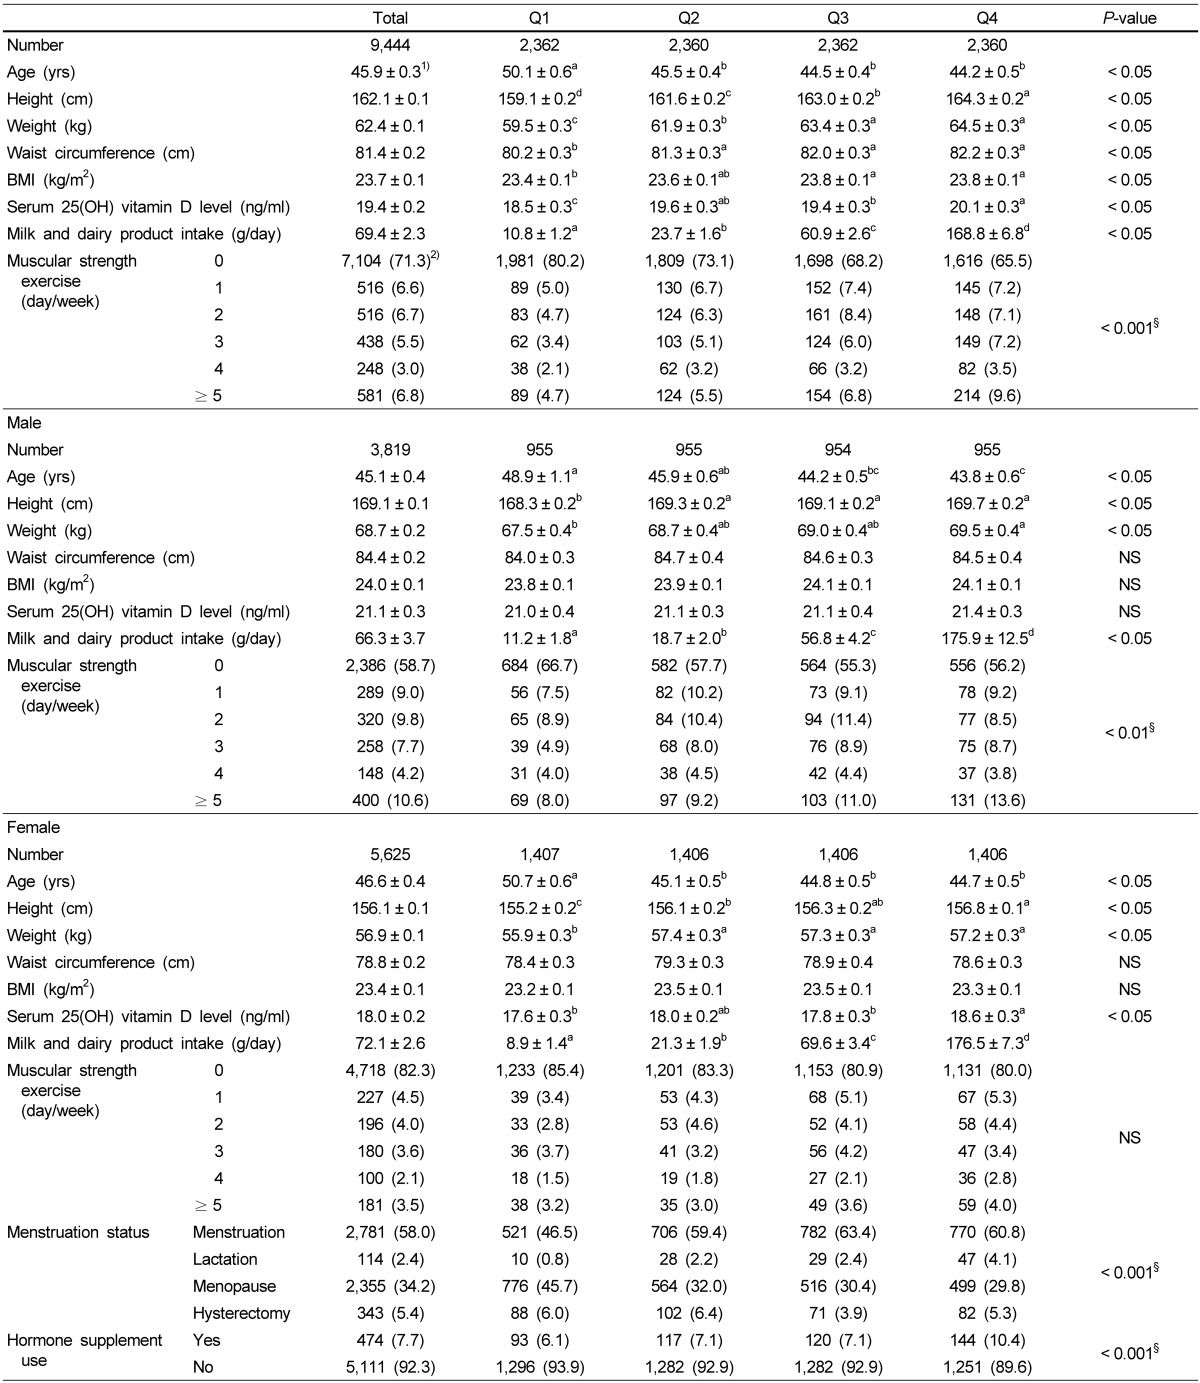
Table 1.
General characteristics of the subjects according to their Ca intake levels

1)Mean ± SE
2)N (%)
NS, Not significant
Values with different superscripted characters are significantly different among the 4 groups at P < 0.05 by Bonferroni's multiple t-test.
Statistical significance was tested after adjusting for age.
§Values by chi-square test
