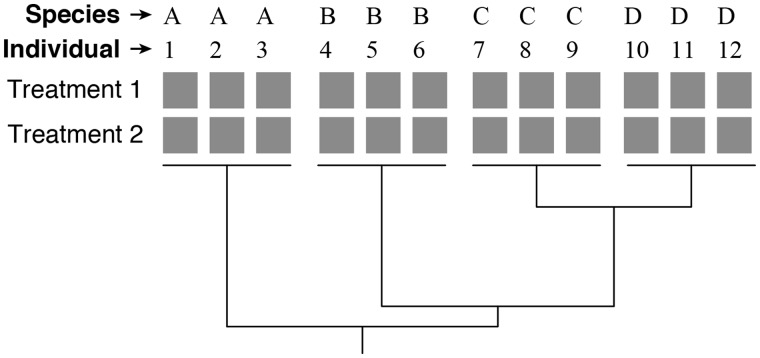
Fig. 1.
A typical project design for phylogenetic analysis of gene expression. The tree depicts the phylogeny of the species, and each of the gray boxes represents a sample. A read count (i.e., an expression measurement) is available for each gene for each sample. In this example, there are 12 individuals sampled across 4 species. In each individual, data on expression are available for two treatments (e.g., tissue types). In some projects, data for different treatments may come from different individuals.

