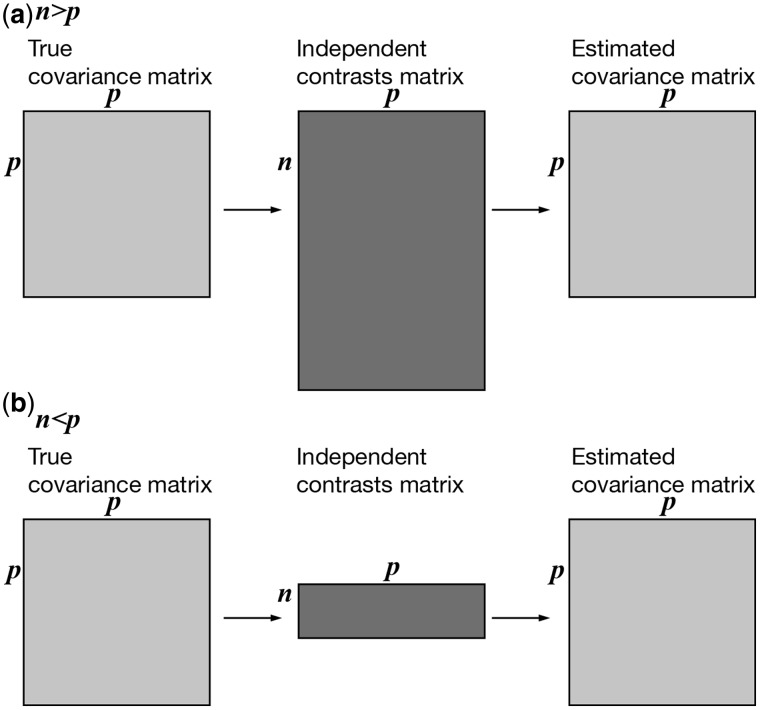
Fig. 2.
An illustration of relative matrix dimensions in comparative analyses. n is the number of observations (independent contrasts) and p is the number of variables (characters) measured in each observation. (a)  , so the independent contrasts matrix is larger than the covariance matrices and it is possible to uniquely estimate the true covariance matrix. This is the case for most comparative studies to date, which consider many more species than variables. (b)
  , so the independent contrasts matrix is smaller than the covariance matrices and it is not possible to uniquely estimate the true covariance matrix. This is the situation for phylogenetic comparative analyses of RNA-seq expression data, as well as other high-throughput phenotype data.

