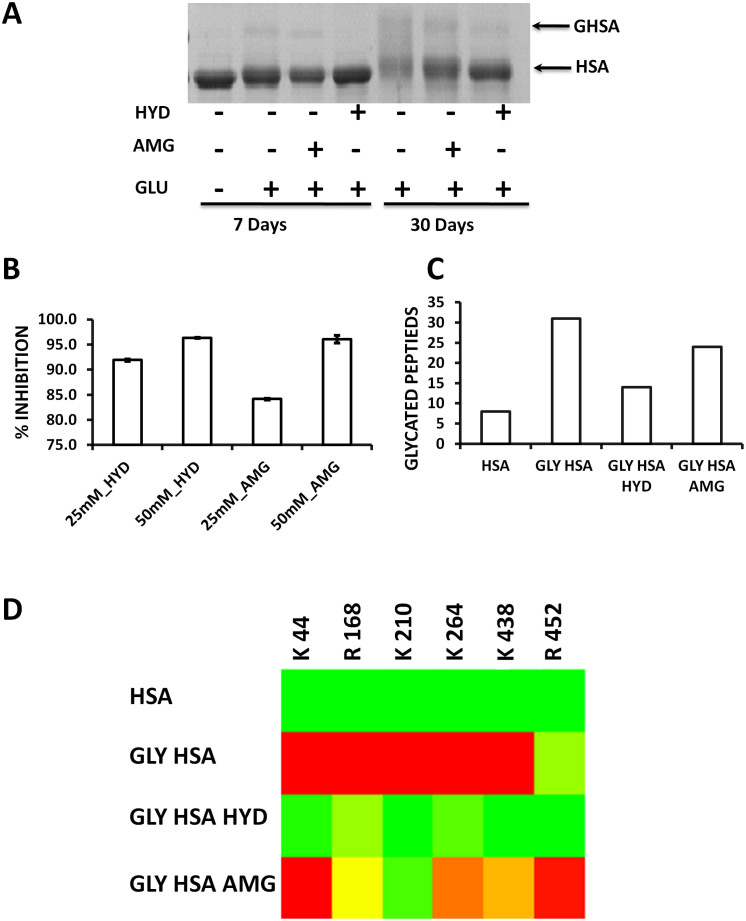
Figure 2. In vitro antiglycation activity of hydralazine.
HSA was glycated in vitro in presence or absence of 25 mM and 50 mM of hydralazine or aminoguanidine at 37°C for 7 or 30 days. (A)SDS-PAGE analysis depicting inhibition of glycation induced HSA crosslinking by hydralazine. (B)Hydralazine and aminoguanidine showed glycation inhibition in a concentration dependent manner as observed by decrease in AGE fluorescence emission at 440 nm. The per cent glycation inhibition was calculated by using the formula (C–T)/C × 100, where C and T are fluorescence emission of glycated HSA without or with inhibitor respectively. The bar graph represents the mean values with standard deviation (n = 3). (C) LC-MSE analysis depicting the number of AGE modified peptides in HSA, glycated HSA, glycated HSA in presence of hydralazine (50 mM) and aminoguanidine (50 mM). The values in the bar graph represent the number of AGE modified peptides in at least two replications. Glycated HSA had more number of AGE modified peptides than unglycated HSA. In presence of Hydralazine and aminoguanidine the number of AGE modified peptides were decreased. (D) Heatmap analysis of AGE modified GSAR containing peptides. The extent of AGE modification of GSAR containing peptides of glycated HSA was maximum. Hydralazine and aminoguanidine treatment decreased the AGE modification of GSAR containing peptides. The values in the Heatmap represent the average cumulative intensity ratio (CIR) of AGE modified peptides containing Glucose Sensitive Amino acid Residues (GSARs) to their unmodified form (n = 2). Heat map was generated using Matrix2png online software.

