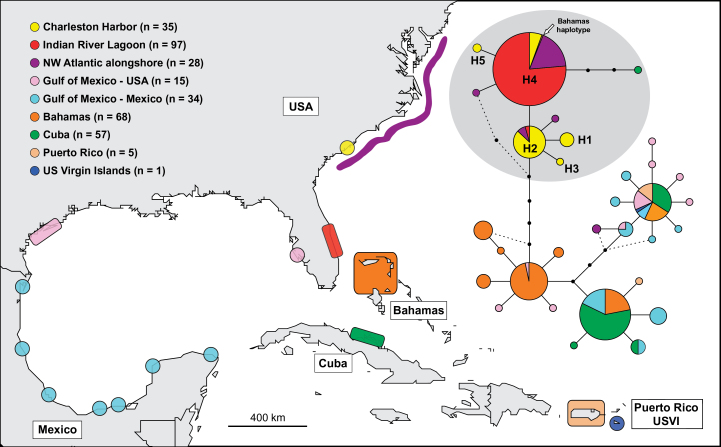
Figure 2.
Map showing geographic location of mitochondrial control region sequences used in the statistical parsimony analysis and the resulting network. Northwest Atlantic offshore haplotypes and haplotypes described as “worldwide form” (Caballero et al. 2012) were not included in the analysis. Sample sizes are shown top left (also see Table 1). In the network, circles represent different haplotypes, color indicates geographic sampling location, and size represents frequency of occurrence. Lines connecting haplotypes represent mutational steps and small black circles represent hypothetical haplotypes that were not sampled. Dashed lines show haplotype connections considered less likely following criteria based on coalescent theory (Crandall and Templeton 1993). The 5 haplotypes discovered as part of this study are indicated as follows: H1–H5. A single individual sampled in the Bahamas possessing haplotype H4 is indicated.

