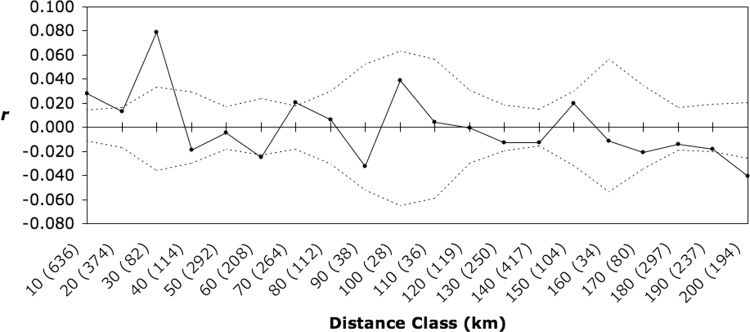
Figure 3.
Correlogram showing the spatial correlation r as a function of distance (20 distance classes, 10 km each). Sample size (the number of pairs compared) for each distance class is shown in parentheses. r values are shown at the end point of each distance class. Dashed lines show the 95% CI around the null hypothesis of a random distribution of dolphins for each distance class. r shows significant deviation from a random distribution for 3 distance classes (0–10, 20–30, and 190–200 km).

