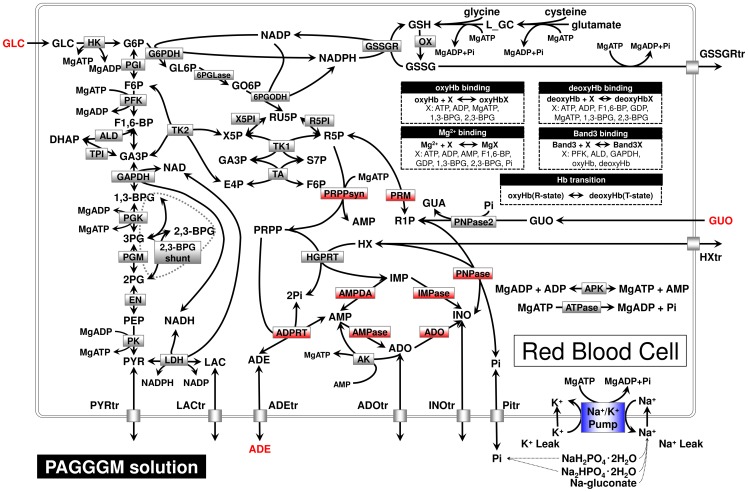
Figure 1. Pathway reactions in the mathematical model of PAGGGM-stored RBCs.
Nodes indicate metabolites or ions, and edges indicate enzymatic reactions or transport processes, which were divided into 3 groups (red, blue, gray boxes) by the difference in sensitivity of enzymatic or reaction activity to temperature or pH as described in our previous study [9]. Abbreviations used in this figure are given in Table 1.

