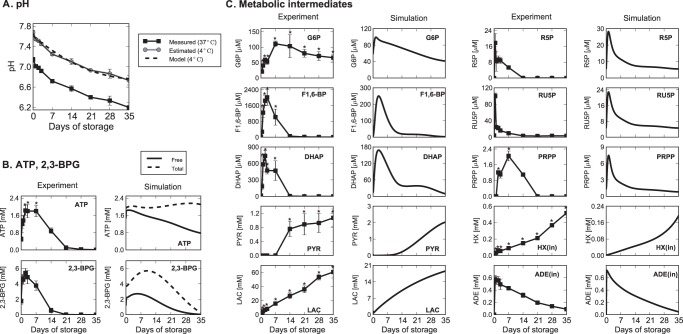
Figure 2. Measured and predicted time courses of pH and metabolic intermediates in PAGGGM-stored RBCs.
Panel A: Time courses of intracellular pH at 37°C (measured values; ▪) and at 4°C (estimated values; •); fitted value used in the model (–). Panel B: ATP and 2,3-BPG were measured by CE-TOFMS (left column) and predicted by the mathematical model (right column) in which free-form (solid black) and total amount (broken black) of metabolites are shown separately. Since intracellular ATP and 2,3-bisphophoglycerate (2,3-BPG) are known to bind to hemoglobin and band 3 membrane protein [8], in our model, free-form metabolite represents its amount in plasma, and total amount of metabolite represents the sum of metabolites (free-form) in plasma and their binding to the proteins. Panel C: Measured or predicted time courses of intermediates in glycolysis (G6P, F1,6-BP, DHAP, PYR, LAC), non-oxidative pentose phosphate pathway (R5P, RU5P), and purine salvage pathway (PRPP, intracellular HX, and ADE), respectively. pH and capillary electrophoresis time-of-flight mass spectrometry (CE-TOFMS) data are expressed as means ± SD of 6 separate experiments. An asterisk indicates that a two-sided p-value is <0.01 versus the Day 0 values.

