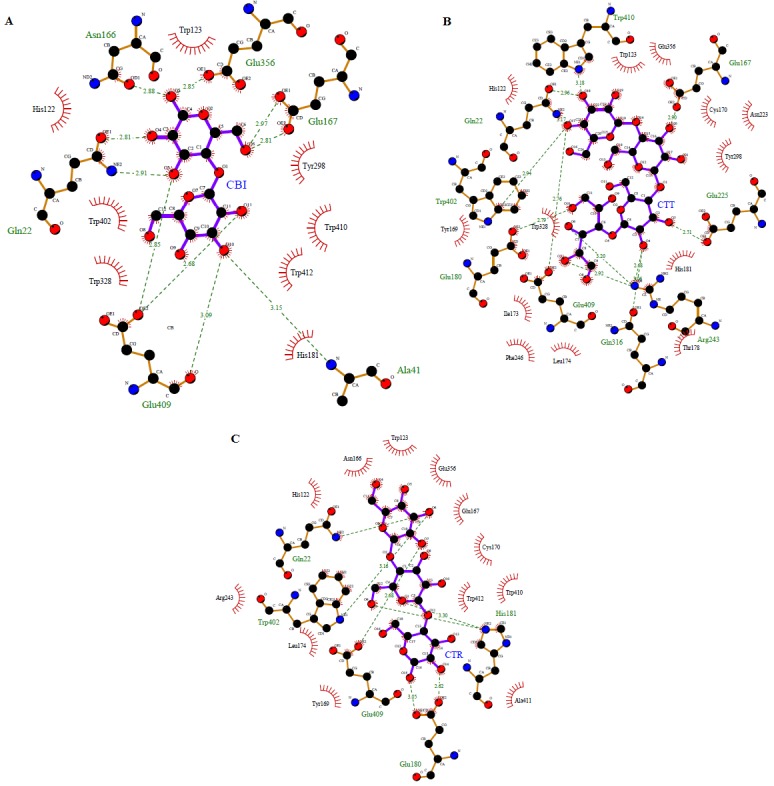
Figure 2.

Image showing the residues within the active site region of beta-glucosidase B– BglB-CBI (Panel A) BglB-CTT (Panel B) and BgIB-CTR (Panel C). The models with the ball and stick belongs to cellobiose, cellotetraose and cellotetriose are shown in the ball and stick models respectively. The green dashed lines represent hydrogen bond formed between BglB and the respective ligands. The red spoke wise arcs pointing towards the ligands indicate the hydrophobic interactions while the ligand atoms with spokes indicate atoms that involved in hydrophobic contacts. Images were generated by LigPlot.
