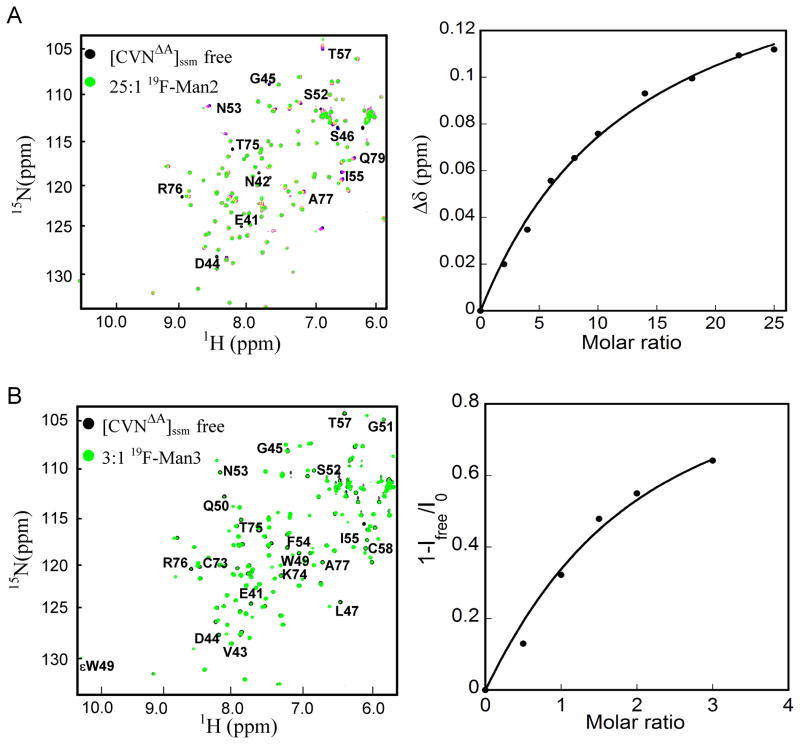
Figure 4.
NMR titration of [CVNΔA]ssm with 19F-Man2 recorded at 298 K and 19F-Man3 recorded at 280 K, respectively. A) Perturbed amide resonances in the [CVNΔA]ssm spectrum clearly reside in domain B and are labeled by amino acid name and number. The left panel display a superposition of 1H-15N HSQC NMR spectra of [CVNΔA]ssm in the absence (black) and presence of 25 molar equivalents of 19F-Man2 (green). The right panel displays the titration curve (chemical shift difference versus ligand/protein molar ratio), with the chemical shift difference defined as: Δδ = [(ΔδH)2 + (ΔδN × 0.17)2]1/2, where ΔδH and ΔδN are the observed chemical shift changes for 1H and 15N, respectively. The system is in fast exchange, as evidenced by a single signal corresponding to glycan free and glycan bound [CVNΔA]ssm. B) Superposition of 1H-15N HSQC spectra of 50 μM [CVNΔA]ssm in the absence (black) and presence (green) of 3 molar equivalents of 19F-Man3 (left panel). The right panel displays the titration curve at glycan/protein molar ratios: 0:1, 0.5:1, 1:1, 1.5:1, 2:1, and 3:1. The system is in slow exchange, as evidenced by separate signals for glycan free and glycan bound [CVNΔA]ssm. The binding isotherm is derived from the relative signal intensities (1-Ifree/I0) (right panel).

