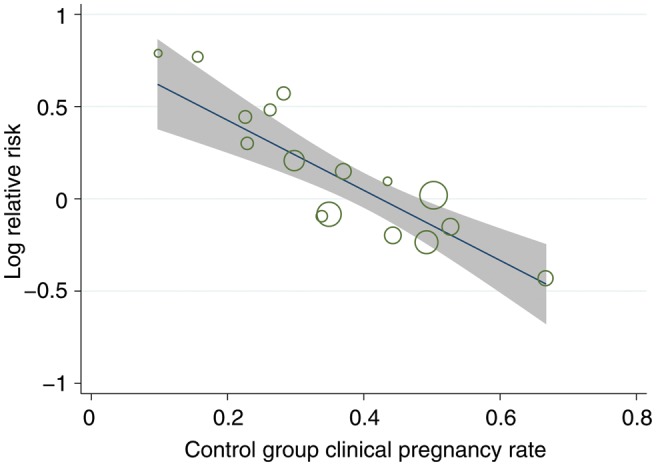
Figure 3.

Meta-regression with baseline clinical pregnancy rate as single continuous covariate. Outcome was RR of clinical pregnancy. Circle size represents weight each study was given in the meta-regression analysis. For this meta-regression, the adjusted R2 = 90% and the  .
.
