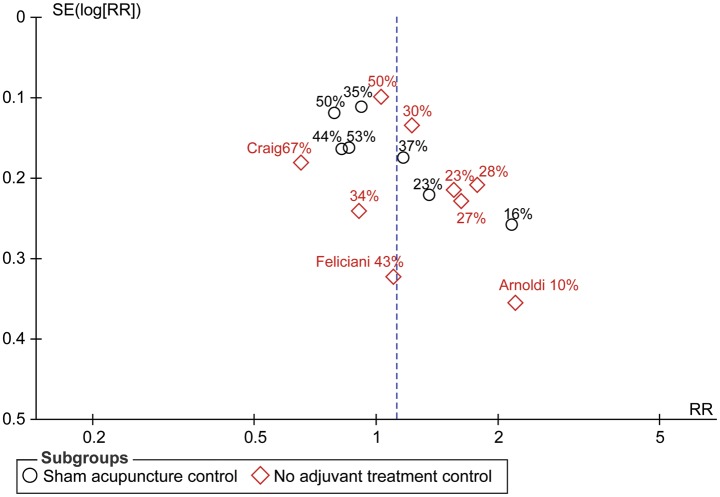
Figure 4.
Funnel plot of trials meeting inclusion criteria. The intervention effect estimated from individual trials is plotted on the horizontal scale and a measure of the standard error of the intervention effect is plotted on the vertical axis. The control group success rate is included for each trial on the plot. The Egger test P-value for funnel plot asymmetry is 0.032.

