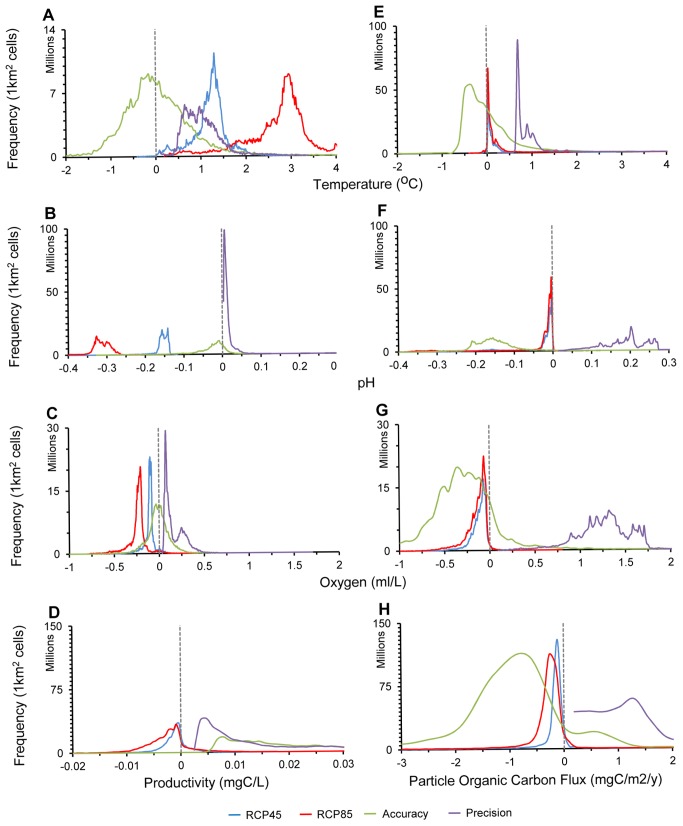
Figure 1. Accuracy and precision on future ocean biogeochemical projections.
Plots A–D refer to sea-surface parameters; plots E–H to seafloor parameters. These plots illustrate the number of 1 km2 cells by their projected change to the year 2100 under the RCP45 (blue lines), RCP85 (red lines), errors in accuracy (green lines), and precision (purple lines). Accuracy was defined as the difference between multimodel average projections and actual data and precision as the standard deviation among the projections of all models. Comparison of these frequency distributions illustrates that errors in accuracy and precision are insufficient to offset projected changes in surface temperature, oxygen, and pH. Note that in those cases, accuracy (green lines) is centered to zero, meaning that for the great majority of cells the multimodel average prediction was identical to actual observations. Errors in precision were often larger, but they are added to both sides of the projections, meaning that they will broaden expected projections but will not reverse them. However, in the case of surface productivity and all parameters at the seafloor, errors in accuracy and precision were larger than the projected change, highlighting the need for caution in those cases. Further details are presented in Table S2; the performance of individual models is shown in Table S1.

