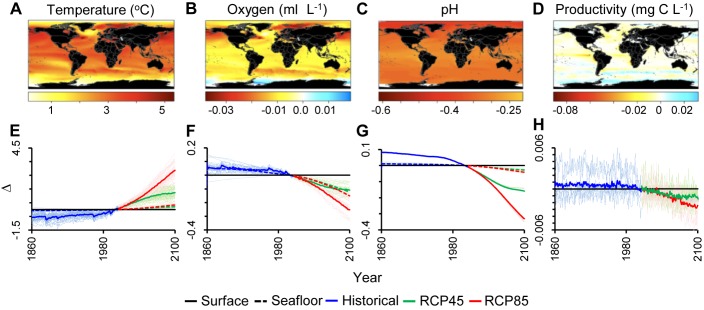
Figure 2. Future biogeochemistry change in the world's oceans.
Plots A–D show the spatial difference between future (i.e., the average from 2091 to 2100) and contemporary (i.e., the average from years 1996 to 2005) values under the RCP85 scenario (decadal averages were chosen to minimize aliasing by interannual variability; beside each color scale we provide the absolute change, whereas the numbers on top indicate the rescaled values; complete results for the RCP85 and RCP45 for the ocean surface and floor are shown in Figure S2). Plots E–H show the global average change relative to contemporary values under the RCP45 and RCP85 at the ocean surface and seafloor; semitransparent lines are the projections for individual models.

