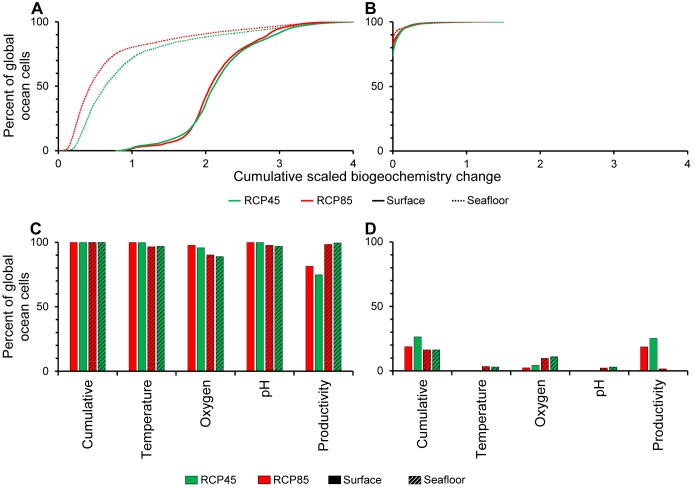
Figure 4. Exposure of the world's oceans to co-occurring changes in ocean biogeochemistry to the year 2100.
(A–B) are the cumulative percentage of cells globally exposed to the composite score of co-occurring ocean biogeochemistry changes (see Figure 3 for details). (A) is for negative and (B) for the positive biogeochemistry changes. (C–D) is the discrimination of total ocean cells globally exposed to negative (C) and positive (D) changes in each variable and the composite score.

