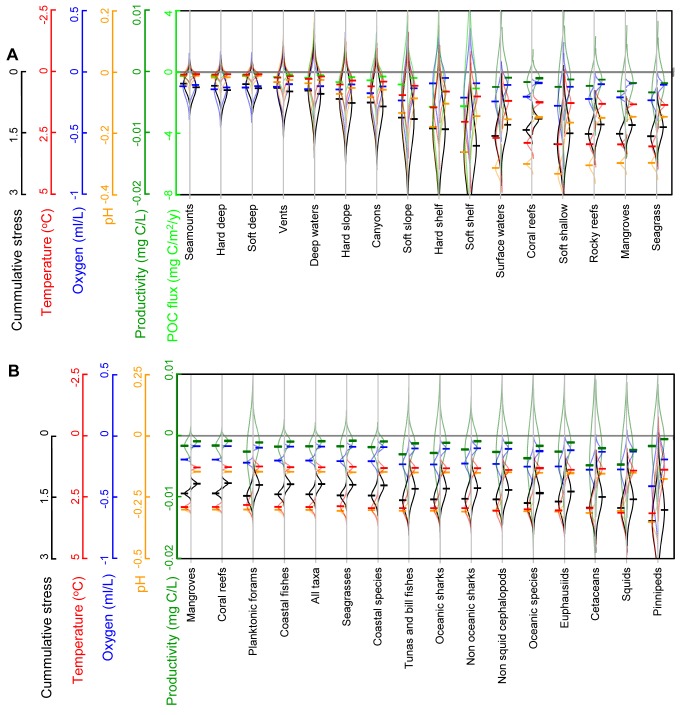
Figure 5. Future ocean biogeochemistry change on marine habitats and biodiversity hotspots.
Here we show the mean (horizontal dashes) and standard deviation (curved lines) of the absolute change in each parameter projected to the year 2100 for each marine habitat (Plot A) and biodiversity hotspot for individual taxa (Plot B). A hotspot is defined as the top 10% most diverse (in number of species) areas on Earth where the given taxa are found [54]. In both plots, values for each parameter are color-coded according to the left-hand axes. Values to the left and right of each habitat or hotspot indicate the expected results according to RCP85 and RCP45, respectively. Data on marine habitats were obtained mainly from Halpern et al. [59]; additional sources are indicated in the Table S6; data on biodiversity hotspots were obtained from Tittensor et al. [54]. Complete results of the exposure of each habitat and hotspots to all parameters as well as the sources of error due to accuracy and precision are presented in Table S4. Particulate organic carbon flux (or simply carbon flux in the legend) applies only to seafloor habitats.

