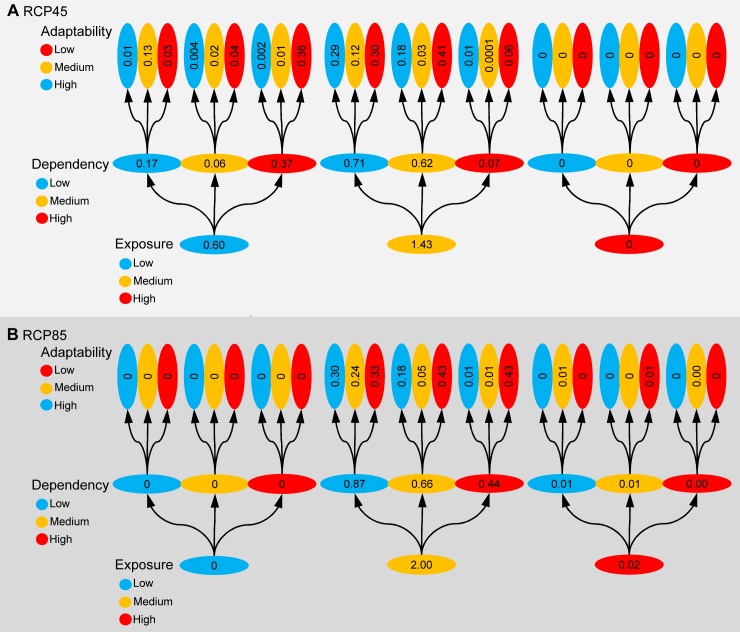
Figure 6. Vulnerability of humans to projected ocean biogeochemistry change.
This plot illustrates the total number of people likely to be vulnerable through exposure to ocean biogeochemistry change according to RCP45 (Plot A) and RCP85 (Plot B). Numbers in the plot are in billions (summations may not be exact owing to rounding). Categorization of people according to their levels of exposure to biogeochemical changes, dependency on ocean goods and services, and social adaptability is described in the main text.

