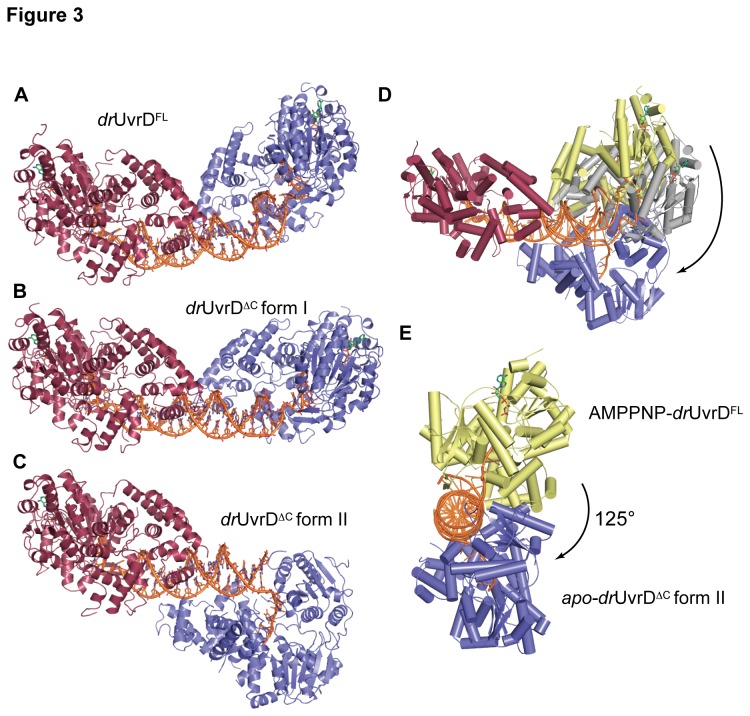
Figure 3. Crystal structures of drUvrD-DNA complexes.
A ribbon illustration of the AMPPNP-bound drUvrDFL is shown in A, the AMPPNP-bound drUvrD∆C form I is shown in B, the mixed AMPPNP-bound (red) and apo- (blue) drUvrD∆C form II is shown in C. The DNA and AMPPNP are shown in sticks. D-E. Large-scale conformational changes. D. Overlay of chains A (red) of drUvrDFL, drUvrD∆C form I and apo-drUvrD∆C form II, illustrating the large spiral movement of chains B colored respectively yellow, grey and blue. The DNA is shown as an orange ribbon. E. As in (D) but viewed down the DNA axis, and for clarity drUvrD∆C form I has been removed.

