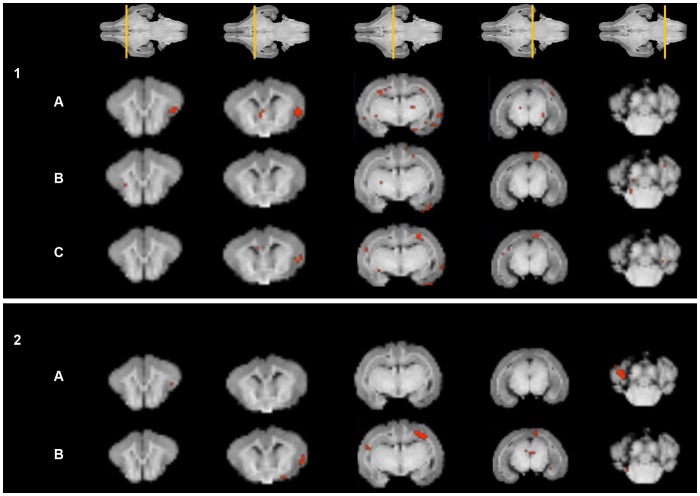
Figure 3. Fractional anisotropy, linearity, planarity and sphericity coefficients: regions showing statistically significant differences (p<0.01) between cases and controls.
Coronal slices of the 3D reference image displaying representative anatomical structures for specific coefficients. Slice locations are shown in the T1 weighted images at the top. PANEL 1: Representative anatomical regions showing a significant decrease in linearity (A) and planarity (B) coefficients and in fractional anisotropy (C) in cases compared to controls. PANEL 2: Representative anatomical regions showing a significant increase in planarity (A) and sphericity (B) coefficients in cases compared to controls.

