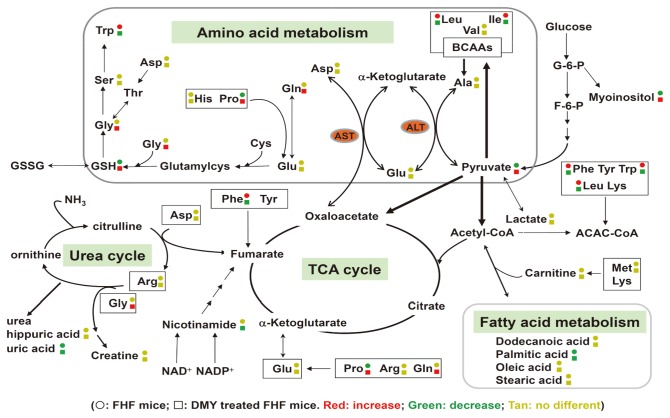
Figure 8. Working hypothesis of the metabolic mechanisms of LPS/D-GalN– induced hepatic toxicity and protection by DMY.
Symbol circle and square represent the relative metabolite changes in the LPS/D-GalN−challenged group and the DMY treatment group, respectively. The decrease, increase and no difference in levels with statistical significance are presented in green, red and tan, respectively.

