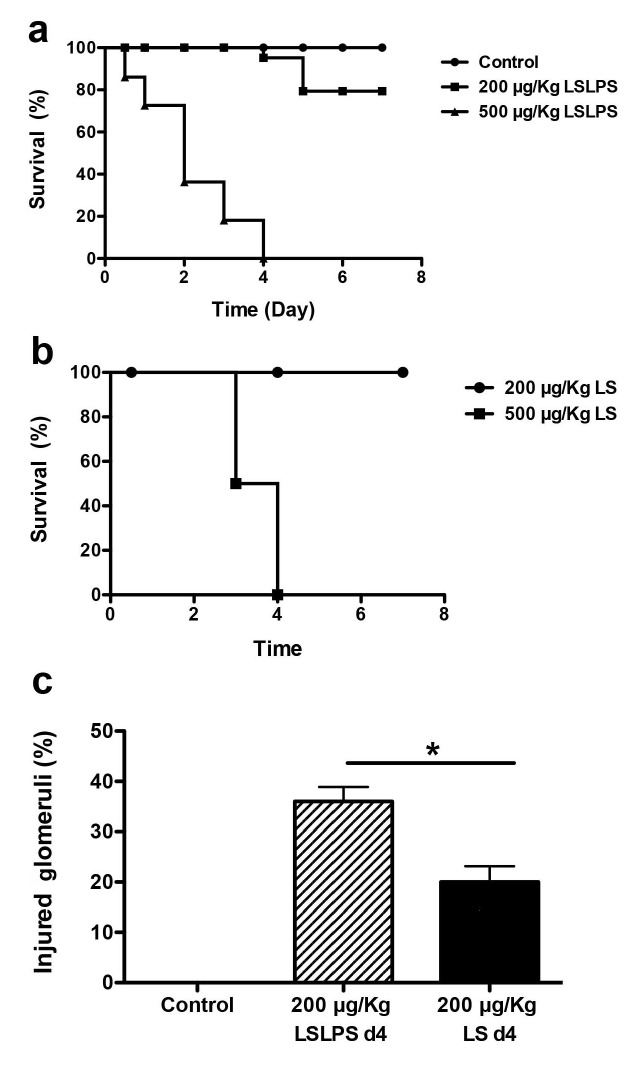
Figure 3. Dose-response effect of LPS/ LS or LS treatment on survival and glomerular injury.
Kaplan-Meier survival graph of mice treated with A) saline (n=8), LPS/ LS 500 μg/kg (n=38), or LPS/ LS 200 μg/kg LS (n=24), or B) LS alone 500 μg/kg (n=4), 200 μg/kg LS (n=14). p < 0.001, LS/LPS 500 versus LS/LPS 200 μg/kg; p < 0.001, LS 500 versus LS 200 μg/kg. c) The fraction of injured glomeruli at Day 4 (n=5 mice/ group; * p < 0.05).

