
Figure 4. Hepatic contents of total lipid, triacylglycerol and cholesterol.
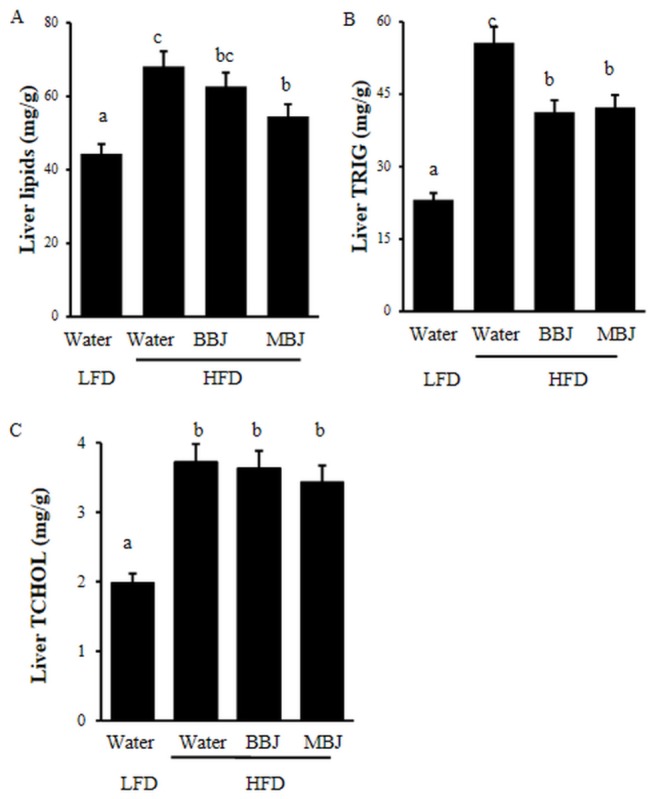
Values are mean ±SEM. The means marked with superscript letters are significantly different relative to others.
Official websites use .gov
A
.gov website belongs to an official
government organization in the United States.
Secure .gov websites use HTTPS
A lock (
) or https:// means you've safely
connected to the .gov website. Share sensitive
information only on official, secure websites.
Values are mean ±SEM. The means marked with superscript letters are significantly different relative to others.