
Figure 6. Gene expression determained by quantitative real-time PCR.
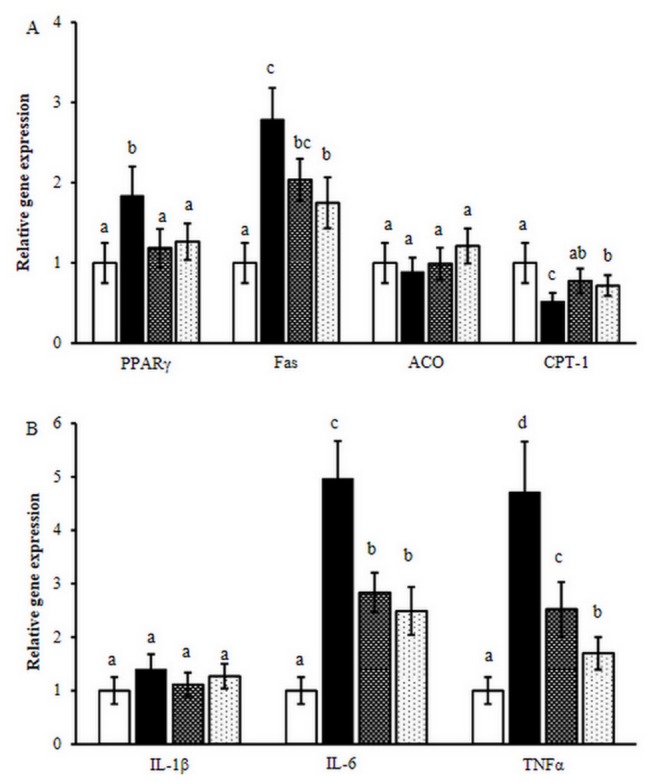
A, Expression of PPARγ, FAS, CPT 1, ACO in the liver tissue; B Expression of IL-1β, IL-6, TNFα in the epididymal adipose tissue. LFD (□), HFD (■), HFD with BBJ (▓), HFD with MBJ (░). The means marked with superscript letters are significantly different relative to others.