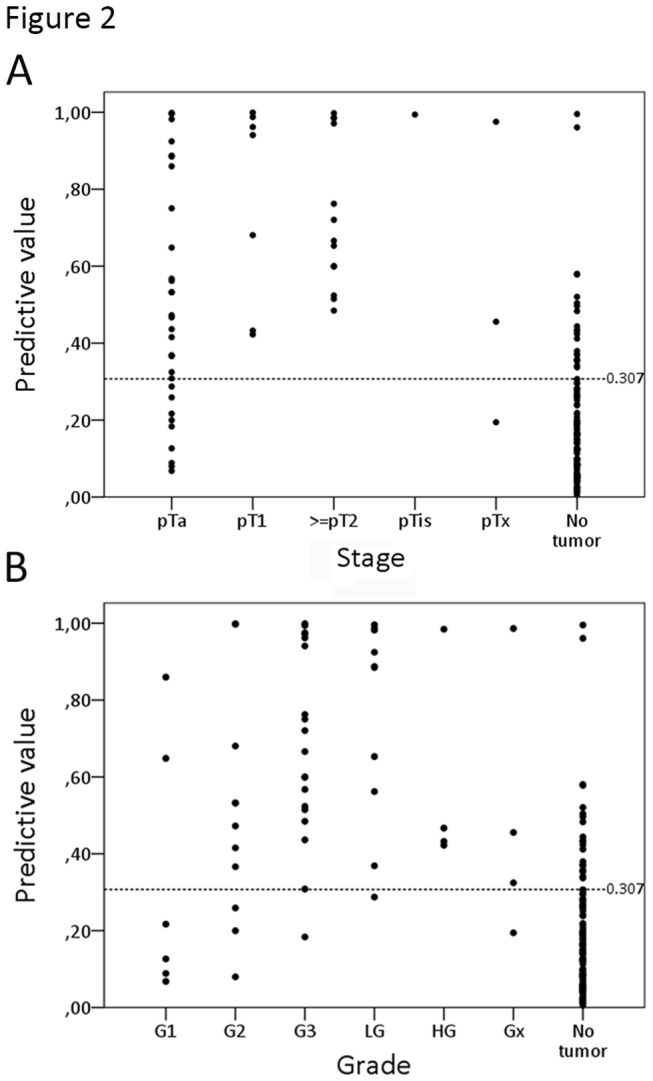
Figure 2. Scatterplot of risk values for the detection of urothelial cell carcinoma (UCC) in patients presenting with painless hematuria.

X-axis depicts stage (A) and grade (B) of the resected tumors. Y-axis depicts the risk value based on the developed logistic regression model. Patients with risk value > 0.307 were considered at high-risk for having UCC. Patients with a risk value < 0.307 were considered at low-risk. Each dot represents a urine sample.
