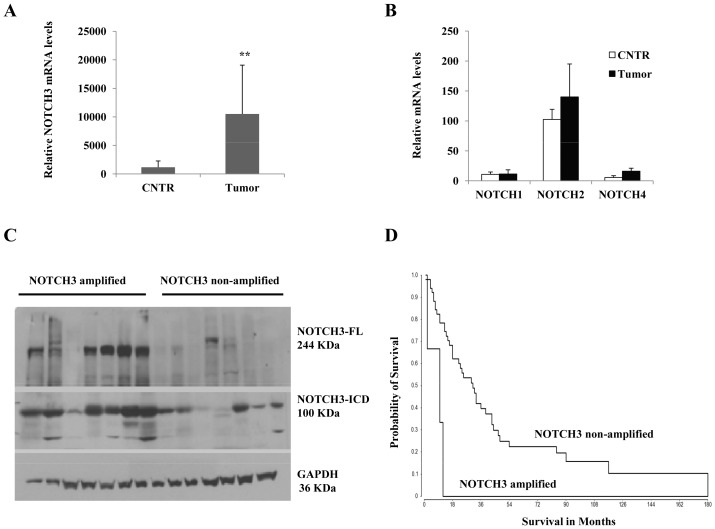
Figure 1. NOTCH3 alterations analysis in malignant glioma samples.
(A) NOTCH3 gene expression in representative specimens using quantitative-real time PCR showing high levels of NOTCH3 transcripts in various tumor specimens compared to non-tumor samples (epilepsy biopsies; CNTR). (B) Relative mRNA levels of other NOTCH members in tumor specimens compared to non-tumor biopsies. (C) NOTCH3 protein expression comparisons in representative tumor specimens using western blot showing different protein levels according to NOTCH3 locus status. Tumors with amplified NOTCH3 locus showing high level of full length NOTCH3 protein (∼244 KDa) and its cleaved intracellular domain (NICD3 ∼100 KDa). GAPDH was used as a loading control. (D) Kaplan-Meier estimate of probability of survival stratified according to NOTCH3 genomic status (Log Rank test, P = 0.00098; median survival 10 vs. 28 months). **indicates p<0.01 (ANOVA).

