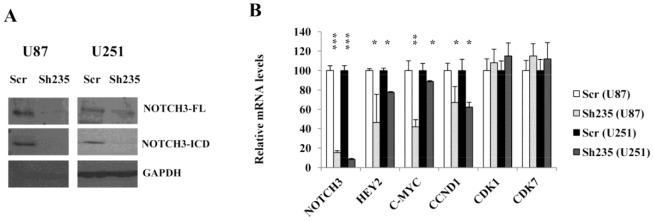
Figure 2. NOTCH3 knockdown in U87-MG and U251-MG cells reduced expression of NOTCH3 and its target.

(A) Western blot of U87-MG and U251-MG cells showing silencing of NOTCH3 protein expression at both full length and cleaved forms following shRNA treatment. GAPDH was used as loading control. (B) Quantitative-real time PCR showing downregulation of NOTCH3 transcripts and several of its known targets in U87-MG and U251-MG cells following shRNA knockdown. *indicates p<0.05, **indicates p<0.01 and **indicates p<0.001 (ANOVA and Tukey’s multiple comparison test).
