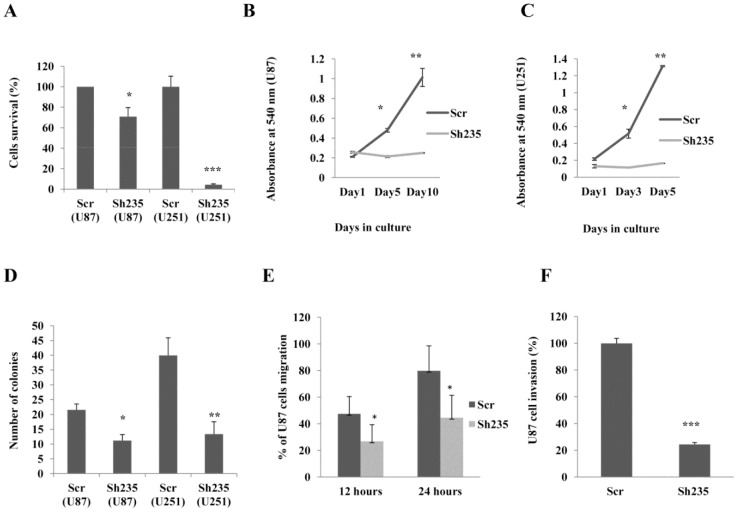
Figure 3. NOTCH3 knockdown in U87-MG cells represses glioma cells growth and hinders cell migration and invasion.
(A) Cell viabilities of U87-MG and U251-MG cells following NOTCH3 knockdown were determined using MTT assay. The data represent mean ± SE of three independent experiments performed in triplicate. (B) Growth curves U87-MG and (C) U251-MG cells resulting from specific NOTCH3 knockdown were monitored with crystal violet staining at indicated time points. The results are plotted as the average growth (A540nm) ± SE of three independent experiments. (D) Colony formation ability of glioma cells was determined with soft agar colony formation assay. Data represent mean ± SE of three independent experiments. (E) Wound healing assay for U87-MG cells. ImageJ software was used to measure changes in cell migration per time in U87-MG cells transduced with sh235 (N = 20) or control (N = 23) lentivirus. Results are expressed as relative migration to the baseline. (F) Matrigel cell invasion assay. U87-MG cells expressing sh235 or scrambled control lentivirus were seeded into the upper chamber of the matrigel coated transwells. Invasive cells were stained with crystal violet, photographed under an inverted light microscope and quantified using ImageJ software in four representative fields. *indicates p<0.05, **indicates p<0.01 and **indicates p<0.001 (ANOVA and Tukey’s multiple comparison test).

