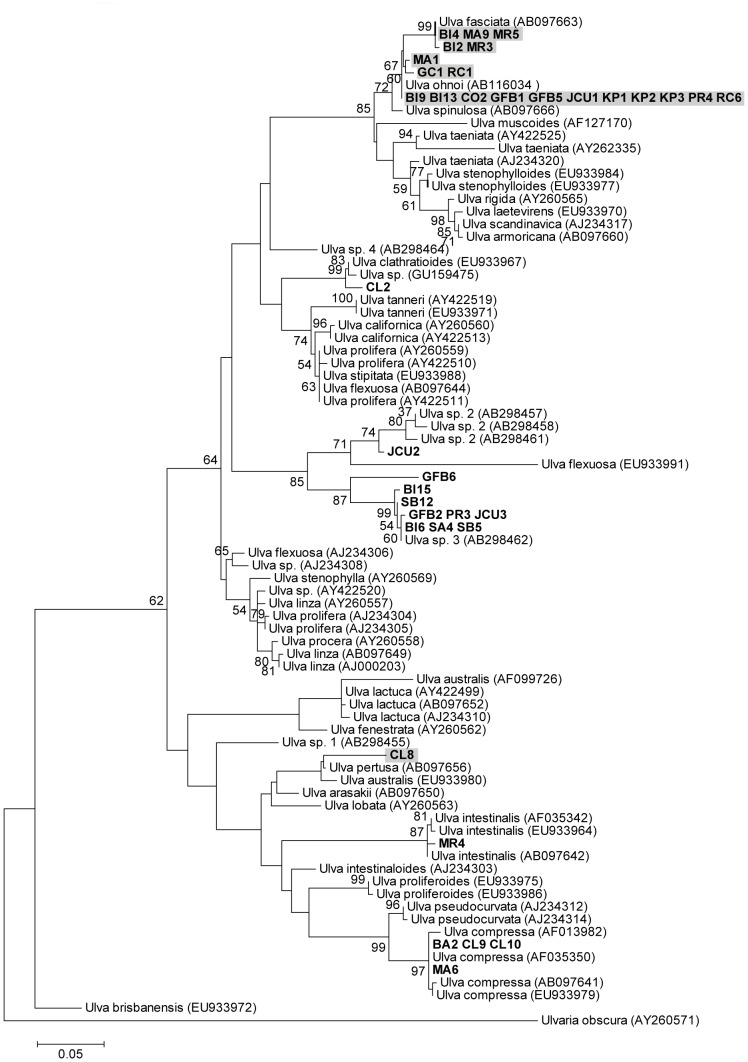
Figure 1. Ulva ITS phylogenetic tree.
Maximum likelihood tree of Ulva internal transcribed spacer (ITS) sequence data (scale at bottom). Numbers near each node refer to bootstrap support values, nodes with <50% bootstrap support are not labelled. Samples collected in this study shown in bold. Shading indicates strains with blade morphologies. Numbers accompanying the species names are GenBank accession numbers for the sequences used in the analysis.

