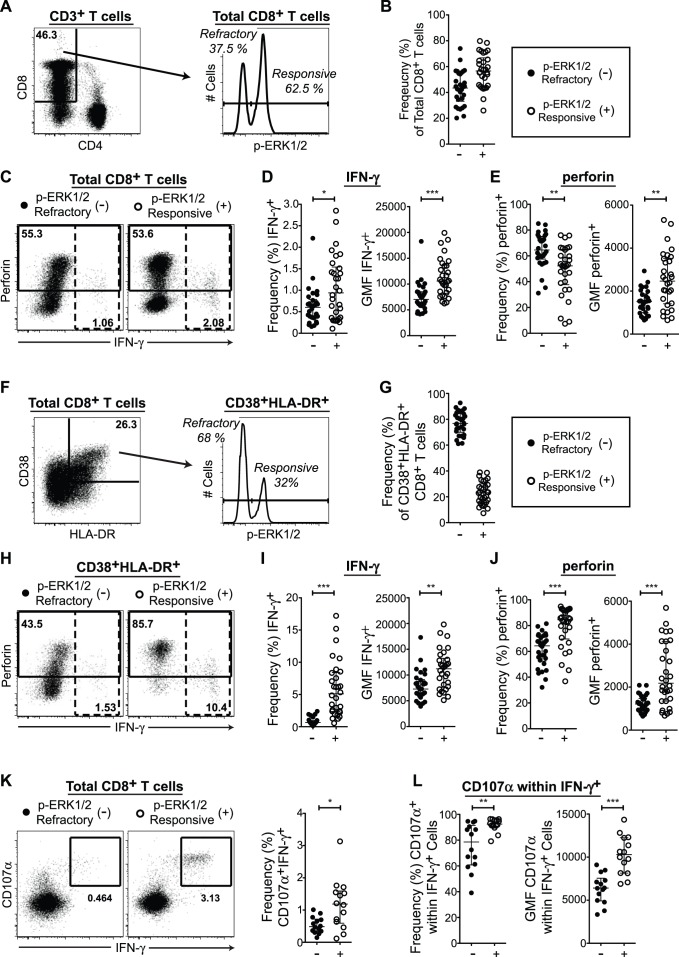
Figure 2. p-ERK1/2-refractory CD8+ T cells exhibit low per cell effector function in response to HIV-1 Gag stimulation.
(A–E) Response of total CD8+ T cells to 12 hours HIV-1 Gag peptides and 20 minutes PMA+I. (A) Gating for CD8+ p-ERK1/2-refractory versus responsive T cell subsets. (B) Frequency of p-ERK1/2-refractory cells. (C) Gating for IFN-γ (dashed gate) and perforin expression (solid gate) within p-ERK1/2 subsets. (D) IFN-γ expression by ERK1/2 signaling response. Left graph displays frequency of IFN-γ+ cells contained within the parent population. Right graph, the IFN-γ geometric mean fluorescence intensity (GMF) of IFN-γ+ cells (E) Perforin expression by ERK1/2 signaling response. Left graph, frequency of perforin+ cells. Right graph, perforin GMF of perforin+ cells. (F–J) Response of highly activated (CD38+HLA-DR+) CD8+ T cells. (F) Gating for p-ERK1/2-refractory versus responsive subsets. (G) Frequency of p-ERK1/2-refractory cells within the CD38+HLA-DR+ compartment. (H) Gating for IFN-γ and perforin expression within activated p-ERK1/2 subsets. (I) IFN-γ expression by ERK1/2 signaling response: Left graph, frequency of IFN-γ+ cells. Right graph, IFN-γ GMF of IFN-γ+ cells. (J) Perforin expression by ERK1/2 signaling response. Left graph, frequency of perforin+ cells. Right graph, perforin GMF in perforin+ cells. (K–L) CD8+ T cells, (K) Gating for IFN-γ+CD107α+ expression and frequency of IFN-γ+CD107α+ cells within p-ERK1/2 subsets. (M) CD107α expression within IFN-γ+ cells by ERK1/2 signaling response: Left graph, frequency of CD107α+ cells. Right graph, CD107α GMF of CD107α+ cells. Significance Not Significant (NS) p>0.01, Marginal (M) p<0.01, *p<0.05, **p<0.005, ***p<0.0005. (A,C,F,H,K, n = 1; D,E,I,J, n = 30; L,M, n = 14).

