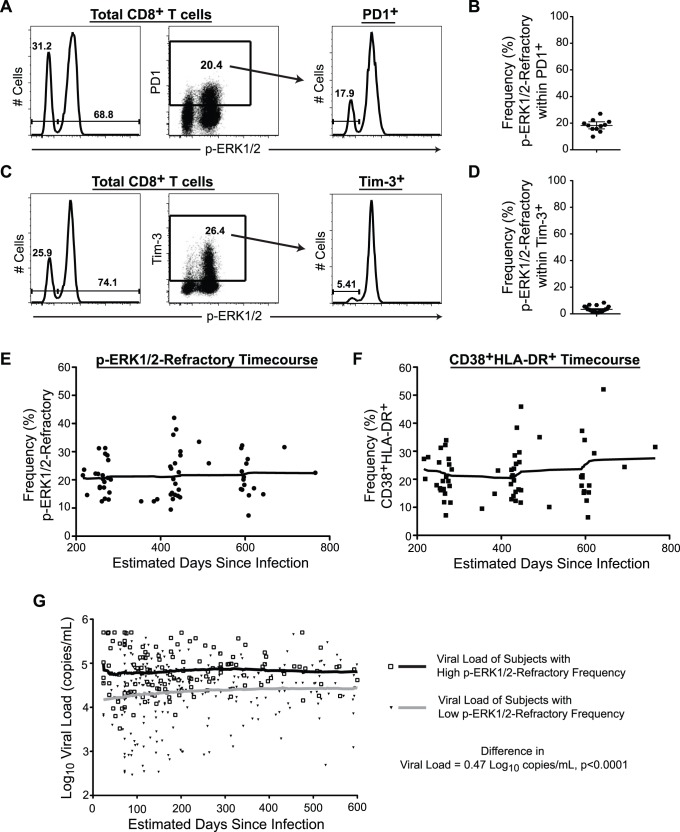
Figure 3. p-ERK1/2-refractory CD8+ T cells are distinct from classical exhaustion, remain stable over time and predict HIV-1 viral load.
(A–D) CD8+ T cells following 20 minutes PMA+I. (A) Panels from left to right: ERK1/2 phosphorylation in total CD8+ T cells. Gating for PD1 expression. Gating for p-ERK1/2-refractory versus responsive subsets within the PD1+ compartment. (B) Frequency of p-ERK1/2-refractory cells within the PD1+ compartment. (C) Panels from left to right: The ERK1/2 phosphorylation response in total CD8+ T cells, Gating for Tim-3 expression in total CD8+ T cells. Gating for Tim-3 expression in total CD8+ T cells. (D) Frequency of p-ERK1/2-refractory cells contained within the Tim-3+ compartment. (E–F) Smoothed moving average plots displaying the frequency of p-ERK1/2-refractory (E) and CD38+HLADR+ (F) CD8+ T cells from HIV-1-infected treatment-naïve adults followed longitudinally over the first 2.5 years of infection. (G) Lowess plots displaying average viral load over time in patients stratified by high or low p-ERK1/2-refractory measurement at study entry. Open squares with black line represents individuals with a first clinical visit % p-ERK1/2-refractory CD8+ T cell measurement above the median frequency. Closed triangles with grey line represents individuals below the median frequency. Individuals with a high p-ER1/2-refractory measurement during early infection maintain significantly higher viral loads over time. (A,C n = 1; B n = 11; D, n = 20; E–F, n = 27 with 2–4 time points per individual, G, n = 74).

