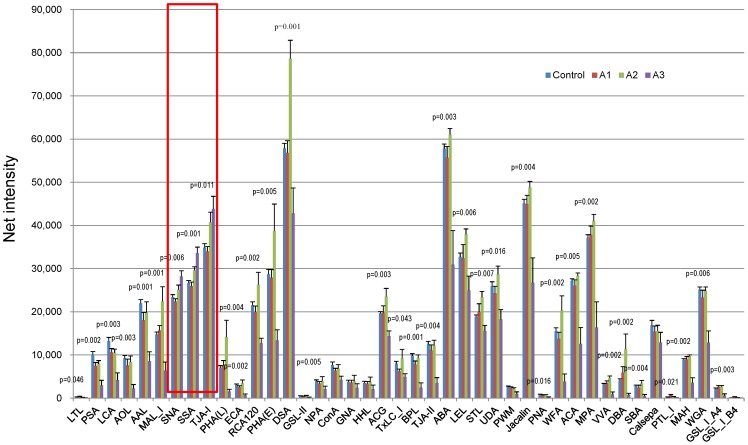
Figure 1. Lectin microarray analysis using urine samples from the patients with various albuminuria stages.
Lectin microarray analysis of urine samples were performed in the healthy subjects without type 2 diabetes (Control, n = 12) and the patients with type 2 diabetes with various stages of normoalubuminuria (A1, n = 7), microalbuminuria (A2, n = 5) and macroalbuminuria (A3, n = 5). Signals to various lectins are compared by Kruskal-Wallis test.

