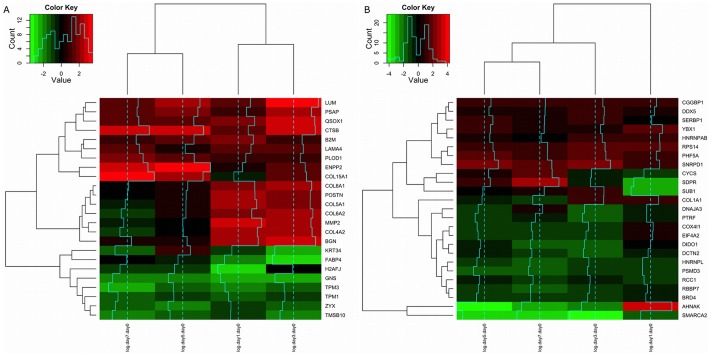
Figure 1. Heatmap of the residuals of the model logFC  logFC
logFC .
.
Protein levels (logFC) of the set of secreted proteins are compared against the logFC of our data set and the residuals of the linear model analyzed; polysomal fraction (A) and total fraction (B). All time points are considered: day 1, 3, 5 and 7 (dendrogram on the top). Genes are on the rows (dendrogram on the left). Only data for genes with large absolute residuals are shown.

