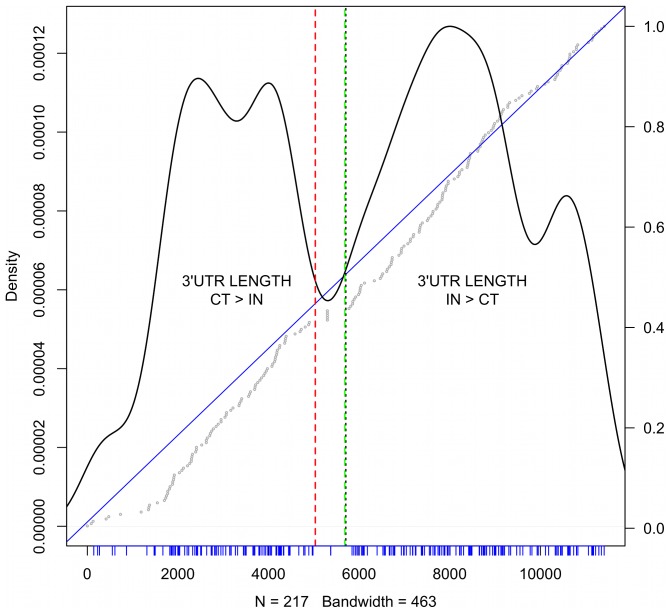
Figure 4. 3′UTR differences for PluriNet genes.
On the x-axis one observes the ranking of 3′UTR lengths as determined in section 1 of all genes used for logFC calculations in the total RNA fraction. The ranking of genes belonging to the PluriNet are shown as densities (y-axis on the left). Negative lengths (CT>IN) lie to the left of the red dashed line. Positive values are to the right of the green dashed line. The wide space between those lines correspond to genes with no differences in 3′UTR length. The median of the rankings is represented as a doted black line. Tick marks in blue represent the ranking positions of the PluriNet genes. On top of the density plot the cumulative distribution of rankings is shown. The straight blue line has slope 1 and intersect 0. Gray dots represent the cumulative ranking of the PluriNet genes. The y-axis to the right indicates the meassure of this cumulative ranking. An under-representation of PluriNet genes with high negative values and a slight over-representation of positive values is observed. Moreover, only marginal PluriNet genes are presenting values of 0.

