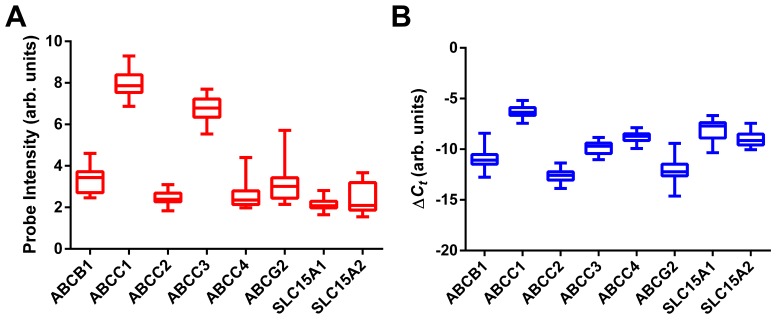
Figure 6. Box plots of expression values for select membrane transporters in 38 vaginal samples from the 6 subjects.
The box extends from the 25th to 75th percentiles, with the horizontal line in the box representing the median; whiskers represent the lowest and highest datum. (A) Normalized probe intensity data from microarray experiments. (B) Normalized RT-qPCR measurements, expressed as 1/[Δ(Ct)] such that increased values correspond to increased gene expression.

