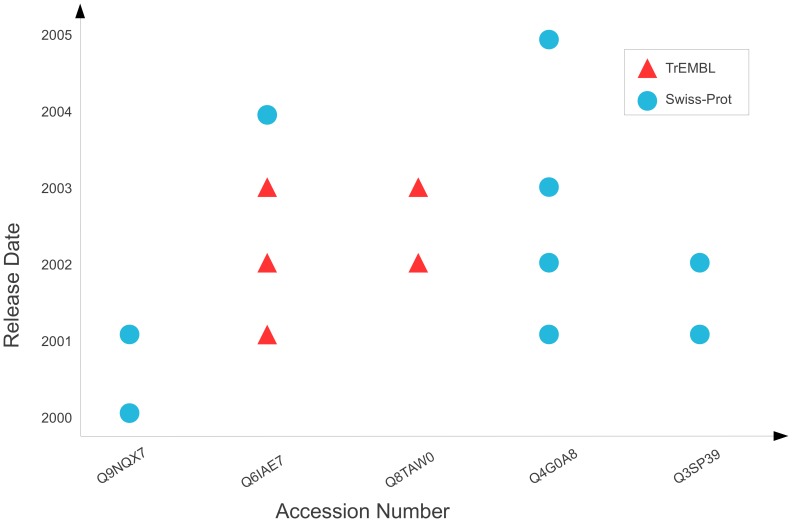
Figure 9. Manual illustration showing how the propagation of a single sentence could be visualised.
Accession numbers are shown on the X-Axis, with database release dates shown on the Y-Axis. A point on the graph represents that the sentence occurs in an entry within a given database version. For example, the bottom left point shows that the sentence occurs in accession entry Q9NQX7 for Swiss-Prot in 2000 – this sentence remains in Q9NQX7 for one more version; it is removed in the following version (in 2002).

