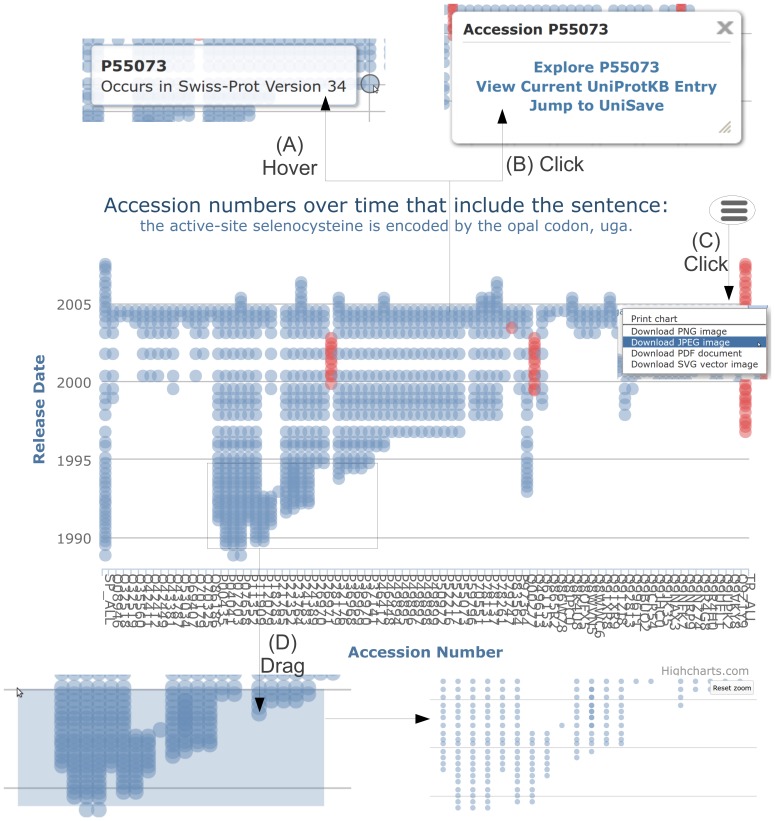
Figure 11. Illustrating the key interactive features provided by Highchart graphs.
(A) Hovering over a point indicates the corresponding accession number and database version. (B) Clicking on a point provides links to the UniProt entry and further information. (C) Each graph can be printed and exported into a variety of image formats. (D) The ability to zoom into a section of a graph; this can be achieved by left-clicking and dragging a desired area.

