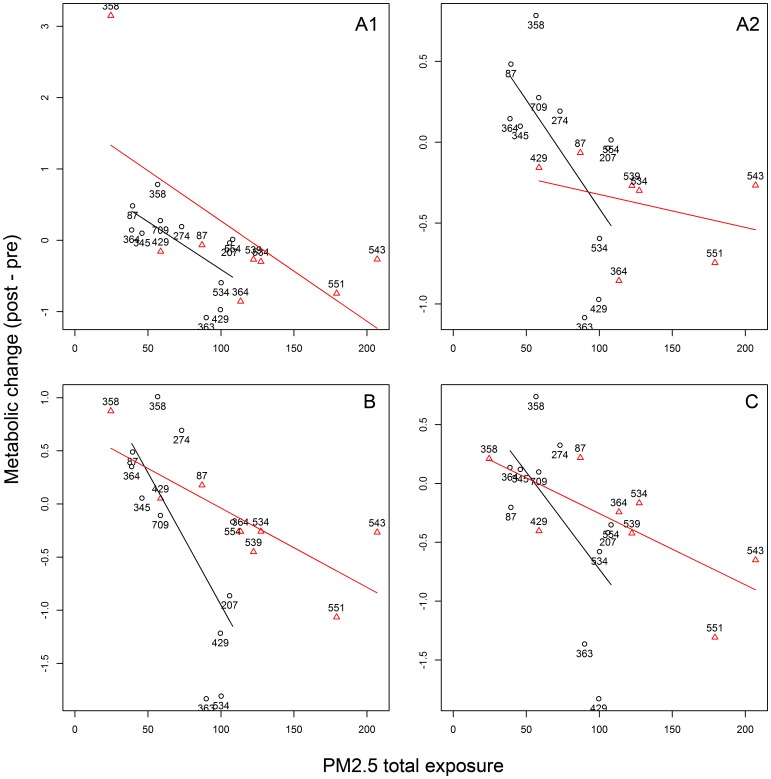
Figure 2. Scatter plots of metabolic changes by exposure of EPA and DPA.
Scatter plots illustrate the biochemical compounds that had a metabolic change significantly associated with welding fume exposure: A1) eicosapentaenoic acid (EPA); A2) EPA after removal of a potential outlier (subject ID: 358); B) docosapentaenoic acid n3 (DPAn3); and C) docosapentaenoic acid n6 (DPAn6). The x-axis represents total PM2.5 exposure during the welding workshop, while the y-axis represents biochemical metabolic change (post-welding workshop – pre-welding workshop). Black circles represent data from Study-2011; red triangles represent data from Study-2012. Each mark is labeled with the subject ID.

