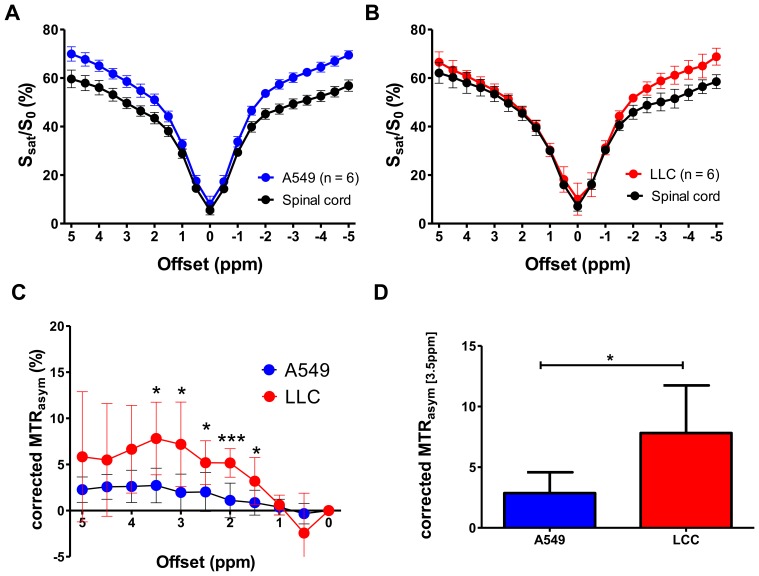
Figure 3. Analyses for Z-spectrum and MTRasym of both types of lung tumors.
Z-spectra of A549 (A) and LLC (B) tumors compared to that of spinal cord as a reference show that the LLC tumor has a larger CEST effect than A549 tumor. Corrected MTRasym spectra of A549 and LLC (C) and corrected MTRasym at 3.5 ppm (D) show that LLC has a larger APT effect than A549, which may be related to the malignancy of the tumors. *, P≤0.05; **, P≤0.01; ***, P≤0.001 by Student’s t-test.

