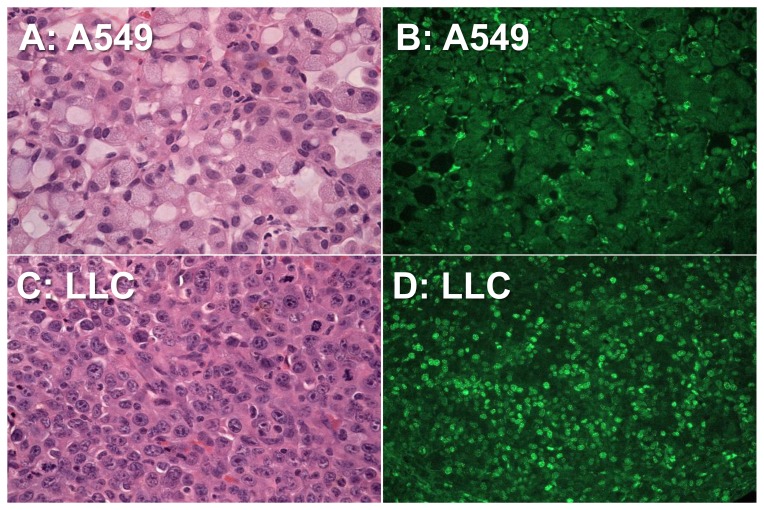
Figure 4. Micrographs of the A549 tumor and LCC tumor.
Hematoxylin-eosin staining (original magnification×400) demonstrates that LCC (C) have higher cell density and larger cell nuclei compared to A549 (A). Ki-67 staining (original magnification×200) reveals larger fraction of positive cells seen in LCC (D) than in A549 (B). This indicates the presence of a larger number of cells in active phases of the cell cycle (G1, S, G2, and mitosis) and thus the aggressive nature of LCC.

