
Figure 2. Verification of the pluripotency of the iPSC lines with the TDP-43 A90V mutation.
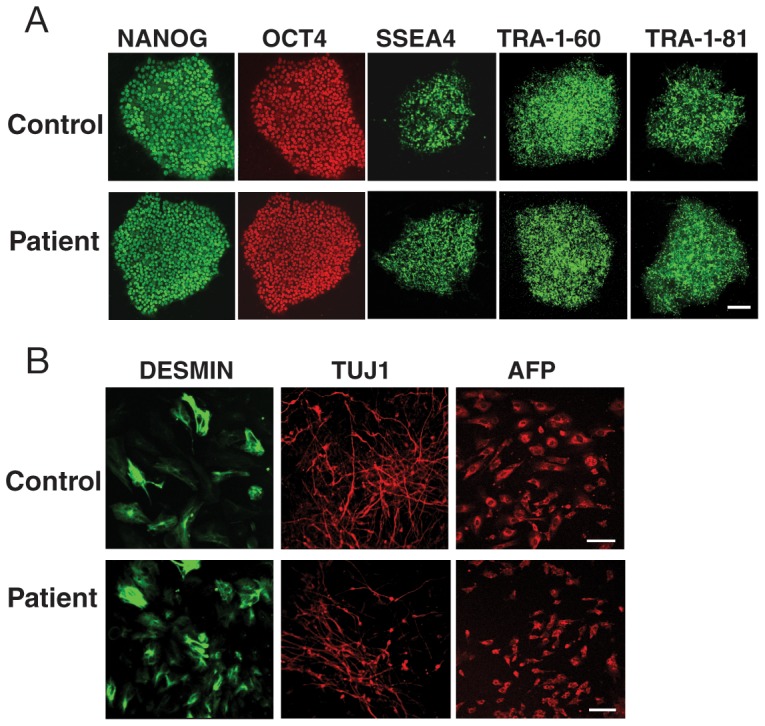
(A) Fluorescence microscopy images of the expression of the pluripotency markers NANOG, OCT4, SSEA4, TRA-1-60, and TRA-1-81 in control (37L25) and patient (36L10) iPSC lines. Scale bar: 20 µm. (B) All iPSC lines differentiated into cells of the three germ layers, as shown by expression of desmin (mesoderm), TUJ1 (ectoderm), and alpha-fetoprotein (AFP, endoderm). These analyses indicate iPSC lines generated here are indeed pluripotent. Scale bar: 20 µm.