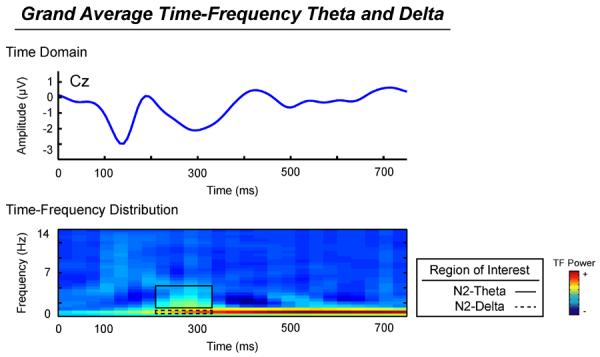
Figure 3.

Top: Grand average time domain ERP, frequency-filtered using a 3rd order Butterworth filter to isolate activity below 14Hz. Bottom: Grand average time-frequency distribution, depicting the higher frequency theta (solid box) and lower frequency delta (perforated box) underlying the N2 component.
